Article 8: How to Analyze a Company’s Income Statement
Introduction
This is our eighth Article and looks at how to analyze the Income Statement of a company. This is our first of three articles dedicated to understanding how to analyze the key financial statements of a company and is an extension of our previous article about financial analysis in general.
Looking at our last article, we see that financial statement analysis is an important part of the company analysis level (that we can also apply to competitor firms to understand the industry competition better). The final goal is to create a forecast to apply our Discounted Cash Flow (DCF) analysis (subject of article 11.) to attach a specific value to the common shares we want to invest in. But there are a few steps we need to go through first. As we will see, the Income Statement (due to ‘accruals’) does not actually show actual cash flows – the essential input for our DCF. So, after we analyze our Income Statement, we will then need to assess the Cash Flow statement (article 9.) as the actual input for our DCF model. The Balance Sheet (article 10.) will be taken into consideration to assess the risk of the forecast that we input into our DCF – everything is connected.
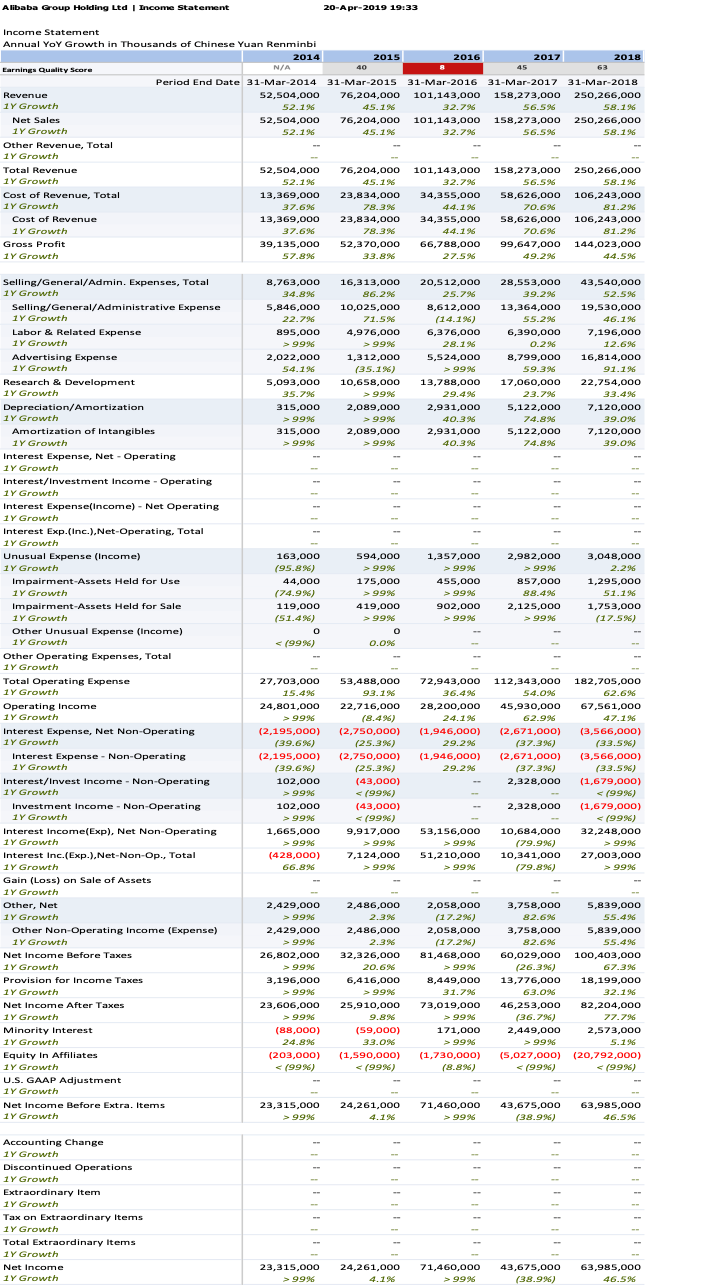
To illustrate our approach, we will use a common-form representation of the financial statements of Alibaba Group Holding Limited, which is registered with the Securities and Exchange Commission (SEC) in America. This statement is shown in full in Schedule I of this article.
Financial analysis: our roadmap to DCF
Our objective is to value the common stock of a company to know whether it is a good investment given the price it is currently trading at. The valuation will be done using DCF and so inputting our forecast of the company’s future cashflows is the critical link connecting all of our analysis to this valuation process. All of the things we assess in our top-down financial analysis are what allow us to confidently predict these future cash flows – but also have an assessment of the risk associated with our forecast. The risk that we attach to our forecast will help determine the interest rate we discount future cash flows. Once again, forecasting return and risk are done in an integrated manner.
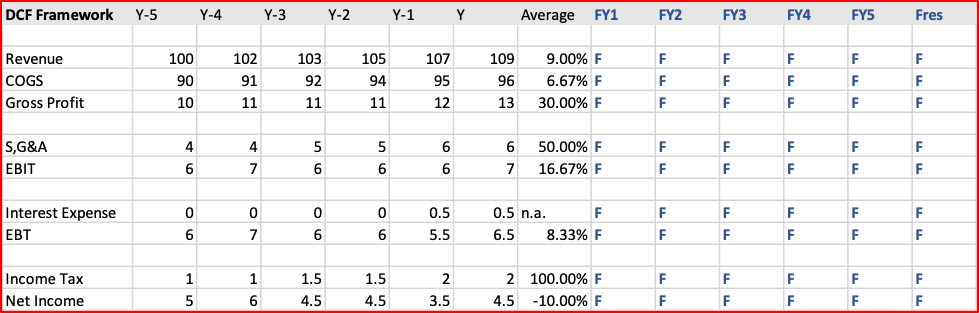
The objective, as evidenced in the above template, is to take the company’s historical data and using our judgement and other market analysis, forecast its future cashflows (the values designated by F). Not shown in the graph is the discount rate we will use; we will come to that later in the article.
Historical Analysis + Judgement = Future Forecast
Trends that we witness in the past may not continue on into the future; circumstances change and the economy may take a new direction meaning a successful firm in the past won’t be successful in the future. But, analyzing past trends is the starting point for any financial analysis.
What period for historical analysis?
The first question we need to address is how long should the period of historical analysis be? Some companies have been in business and producing statements for over 100 years, should we analyze the entire 100 year-period? The answer to this specific question is ‘no’. Putting the practical question of so much work aside, what trends existed in the economy 100 years ago are almost certainly irrelevant to how an industry operates today. So, in almost all cases, we tend to review a ‘current period’. But, what is a current period?
For companies listed in America, the period set is for ten years of historical information, if available. Choosing any period is, by definition, arbitrary, but this period focuses on the more recent information and if of a length that is longer than the ‘business cycle’, which (prior to 2008) was assumed to be about five years. We want a long enough period to see how the company performed when the economy was both weak and strong.
What trends are we looking for?
Our cashflow forecast will be built on information we take from all aspects of the financial analysis and not just the financial statements. Each will contribute specific information to build a comprehensive and valid forecast. The two important sources of information from the Income Statement are:
- Growth in revenue
- Profitability of operations
We have talked many times about the importance of ‘growth’ in the valuation of companies. In theory, we mean ‘profitable revenue growth’, but over the long-term. If we have (profitable revenue) growth, then the value of the company’s shares will rise alongside that growth. In addition, the growth in revenue of a company will also indicate to us where the company is in its industry life cycle and, thus, what its maturity and risk is likely to be. However, growth is also a relative measure; a 5.0% growth in revenue might seem high in America where the economy struggles to grow at a rate of more than 3.0% per year. But, 5.0% would not be a high growth rate in China where the economy has been growing at over 6.0% in recent years. This is why any company must be studied in the context of the industry and economy it operates in. In our hypothetical example below, we see a company’s revenue has grown, on average, 9.0% over the last five years.

Long-term profitability is essential for any company. If it does not make a profit it cannot pay any dividend and its common shares will be worthless. There are two elements of the profitability analysis we must be aware of. First, new companies may grow their revenue before they become profitable.
Evaluating start-up companies that are growing but making losses is common. Mature companies would have to have become profitable or they would not have survived to the current period.
When we are looking at profitability, there are two areas we focus on in the Income Statement, as illustrated below.
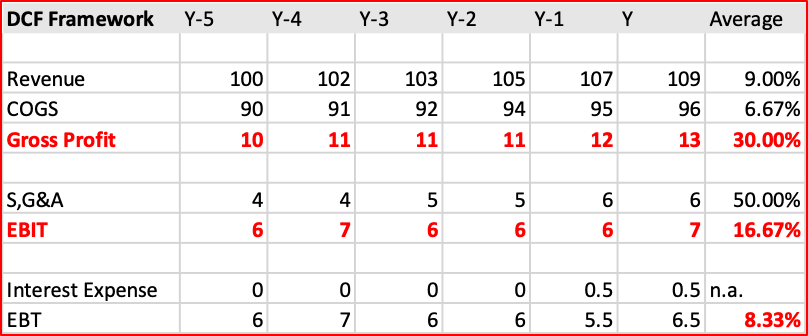
The first area we consider is the company’s Gross Profit, or the difference between what it sells its goods and/or services for and what it pays Suppliers for those goods. The first year (Y-5) we see, on average, that it sold its goods for 100 and paid 90 for those goods, its profit margin was 10.0%. In the current year, the company sold for 109 what it cost 96 to purchase and this is a profit margin of 11.9%. So, in summary, revenue was growing over the period (good) and revenue was growing faster than its Cost-of-Goods-Sold (COGS) and so its profit margin was also increasing. These are clearly two good trends.
The COGS are what we call variable costs (VC) as these costs are directly related to the level of sales revenue (assuming the company does not increase its inventory). However, there is a second category of costs called Selling, General & Administrative (S,G & A) that are more general costs and relatively fixed in the short-term. These costs are finance, human resources, marketing and other business expenses that are not directly correlated to the level of sales, at least in the short term. When we deduct these costs from the Gross Profit we derive the Earnings before Interest and Taxes (EBIT). We can see that the EBIT grew faster than Revenue (good) but not as fast as Gross Profit (maybe not good but requires more analysis).
The absolute figure and percentage of S, G & A also highlight another issue to consider. We are interested in percentage change and costs are a percentage of revenue. But, percentages are not standardized for size; the increase in S, G & A seems very high at 50.0% but this is because it is an increase in a very small number.
Investors will also be interested to see what the Interest Expense and Earnings before Taxes (EBT) are as this is an indication of how much debt the company has taken on, which is a fixed financial cost and a source of financial risk. We would also have to look at how much in taxes the company pays but tax rates are set by government and not under the control of the company.
Let us take a look at the Alibaba statement with this analysis and see what questions and observations are raised.
Example Analysis: Alibaba Group Holding Limited
Let us now take the thoughts in the above article and apply them using the 20-F (annual financial report of a foreign issuer in the United States) of Alibaba Group Holding Limited. Note that Alibaba only listed in America in 2014 and so only shows results from that time. Though it started operations before 2014, it did not use US GAAP then and so its results were not comparable before 2014.
Revenue Growth
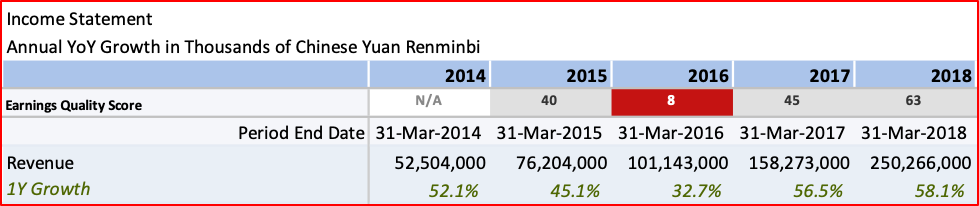
The company’s Revenue is growing at annual rates between a low of 32.7% (2016) and a high of 58.1%. This is a very high growth rate, well above what the Chinese economy has been growing at during this period. Looked at alone, this is a very positive result.
As a caution, though, we see that the growth rate has not been consistent in its direction. From the period 2014 – 16 it actually dropped two years in a row. It then rebounded strongly in the most recent two years. Thus, the analyst would have to consider carefully what growth rate to use in the near-term; closer to 32.7% or 58.1%?
Gross Profit
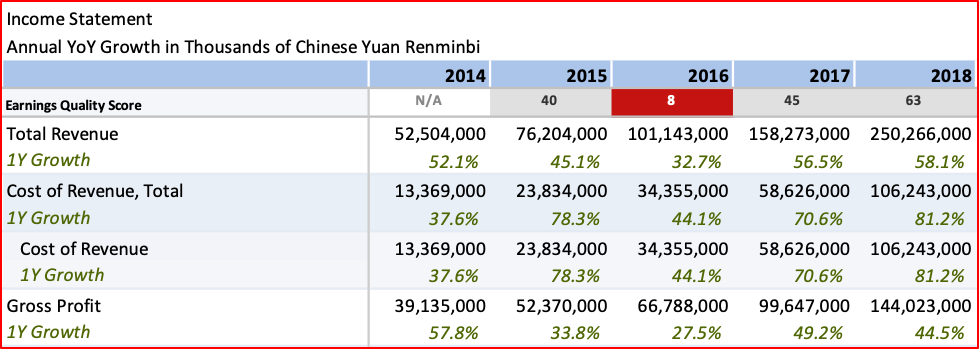
This illustration shows us the dilemma of using percentages just to measure growth without also showing the percentage breakdown during each year of costs to expenses. For example, we see that Cost of Revenue grew at 81.2% in 2018, which would not seem good. Yet the Gross Profit for that year actually increased to 44.5% (from 27.5% in 2016, but down vs. 2017 of 49.2%). The very high rate in the growth of revenue (58.1%) largely offset the huge increase in COGS of 81.2%. But, we can see that the relationship between Revenue growth and Gross profit is not consistent and needs further, in-depth analysis. So much of our initial analysis will raise more questions than answers and much more detailed analysis to understand these trends will be required.
EBT
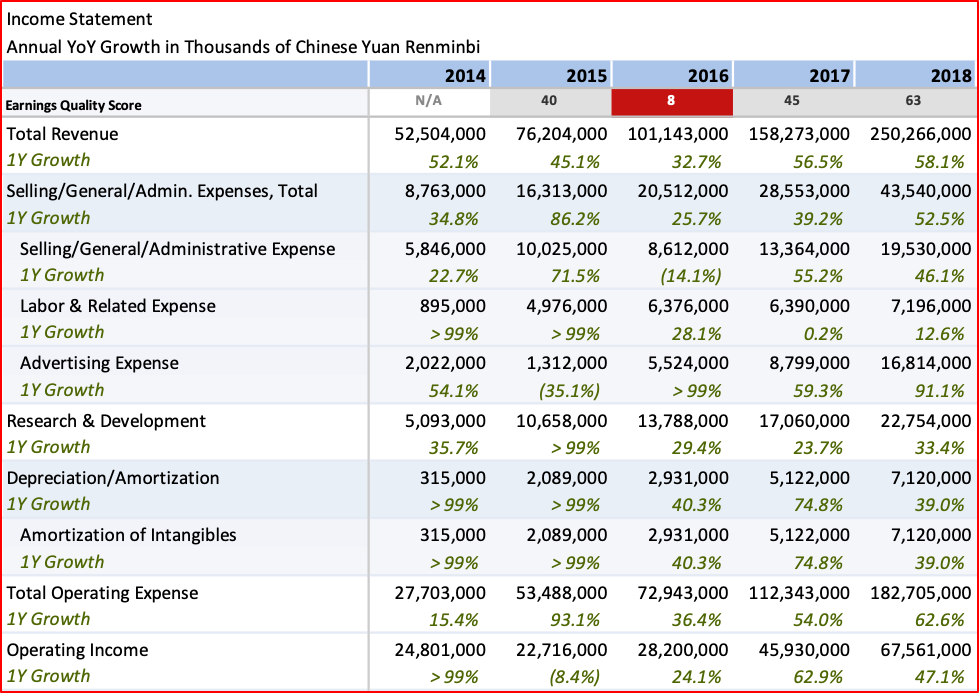
We can see that a lot of different items are covered in S, G & A. Some key items for examination are:
- Labor (employee) costs
- Advertising (marketing)
- Research and Development (R&D)
All of these individual items would require substantial analysis and I just make a few observations. The company refers to EBT here as Operating Income, in accounting many items have several different names meaning the same thing. Each year the EBT is profitable but we actually saw it decline in one year (2015). We are also seeing a lot of variability in these numbers; total S, G & A increased by 86.2% in 2015 but only by 25.7% in the following year. This will make it much more difficult to decide what to extrapolate these figures at in the future. We can also see that R&D is an important item for Alibaba.
One can see that, at the first step, financial analysis can raise more questions than answers. That is one of the reasons that Financial Analysts will also schedule a meeting with company management to address these questions as not all answers can be found by just reading the reports – though the reports are an important first step.
Concluding remarks
Financial analysis is a complex subject that requires a systematic approach to the analysis of data and markets. The top-down, four stage model introduced in the last article is a common approach taken by equity analysis, though there are other models as well. This article looks at our first step of company financial analysis by reviewing the Income Statement. The next three articles will look at further company financial analysis (articles 9 & 10) and close off with discounted cash flow analysis (article 11) to reach our valuation objective.
*****
Having a systematic approach to financial analysis and investing is important, it ensures consistency in analysis and decision making. There is a great amount of information in the market but taking the approach in this article (and the following four articles) gives you a way to manage all this information and synthesize it in an effective way. Yes, financial analysis can be difficult and time-consuming, but there are no easy ways to make good decisions in complex situations. It requires a sound method, time and experience.
John D. Evans, CFA (author) has over 24 years’ experience in the international capital markets working with issuers of securities and investors around the world. He has designed and taught Master’s programmes in investment management at universities in the UK and China. He was most recently Professor of Investment Management at XJTLU in Suzhou. He now manages SEIML, a consultancy to early-stage companies in China.
Jina Zhu (translator) did her Master’s in Economics in France and is fluent in Mandarin, English and French. She also works at SEIML supporting early-stage companies grow and raise capital in China.
22 April 2019
Schedule I – Income Statement of Alibaba Group Holding Limited 阿里巴巴集团控股有限公司利润表