Introduction
This is our eleventh Article and looks at how to value a company using the discounted cash flow (DCF) model. Our last four articles all related to specific areas of company financial analysis whereas this ‘puts it all together’ to give us a final (or intrinsic) value for the common shares of a company. We can then use this theoretical value to compare to where we can buy the stock in the market to determine whether it is a good investment to buy or sell.
Again, to conclude our approach to valuation, we will continue to use the common-form representation of the financial statements of Alibaba Group Holding Limited, which is registered with the Securities and Exchange Commission (SEC) in America. These statements have been shown in full in Schedule I of the previous four articles.
The steps to building the model
In today’s article, we will build the DCF valuation using four steps, all of which we have done before. These are:
The above four steps will then give us a theoretical (intrinsic) value for the company. Though the DCF model is a fundamentally correct model to value a company, it is highly dependent on a few key assumptions we make (and will highlight in our analysis). Thus, as a second step, we will look at other valuation indicators to test our DCF value for ‘reasonableness’.
Step 1: historical analysis and ratio analysis
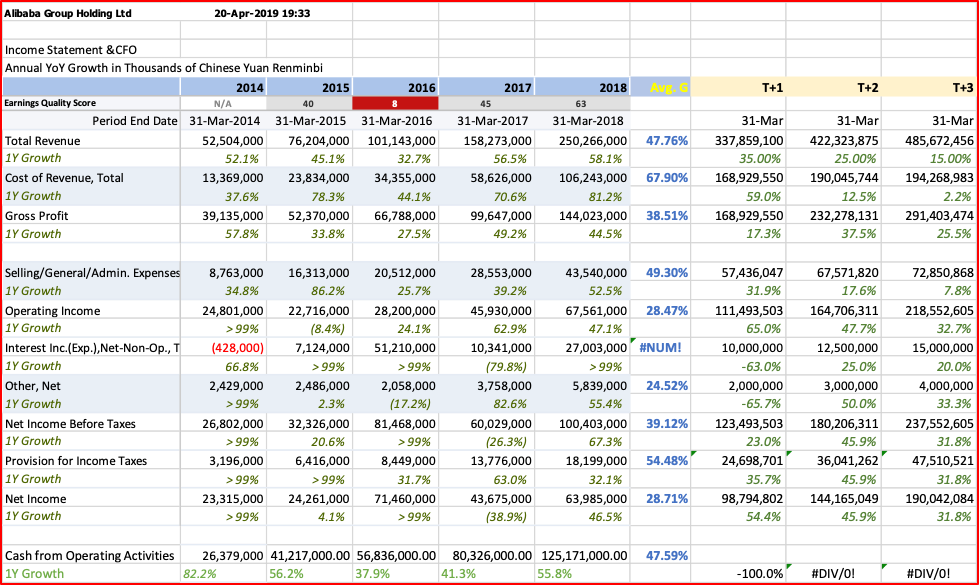
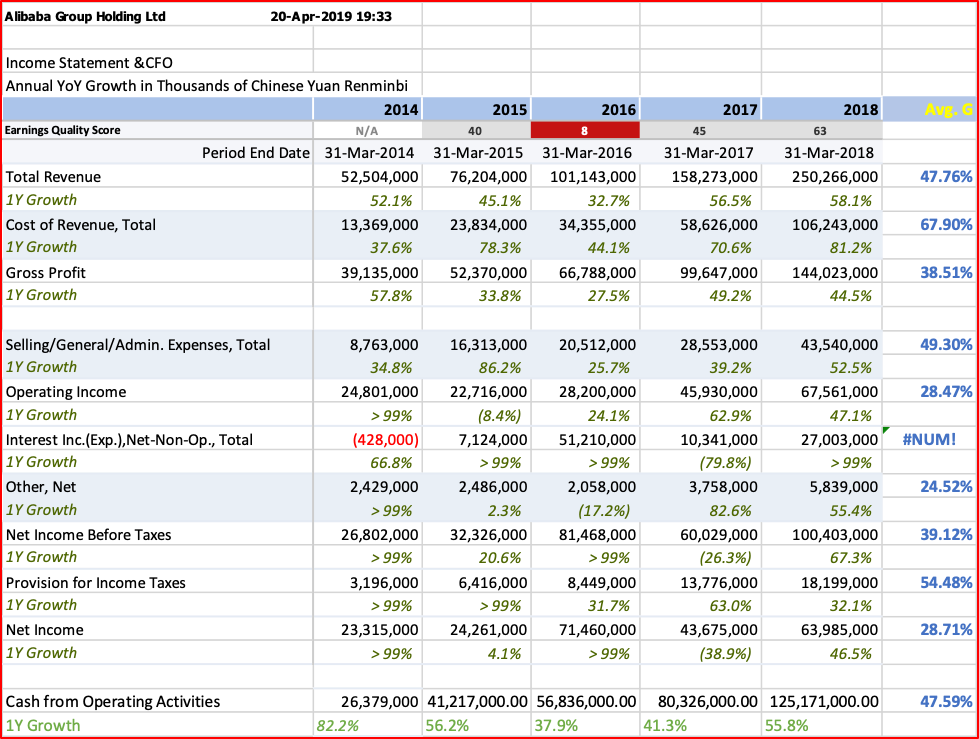
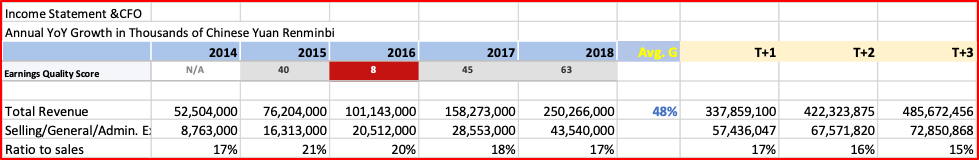
The past won’t allow you to predict the future with certainty, but past trends are a good starting point for any analysis. This is particularly true with larger, established companies where financial trends are likely to continue barring any major ‘disruption’ in its industry. To start this analysis, we have taken the Income Statement and added to the bottom of it the cashflow from operations (CFO). We have talked in article 9. About ‘timing differences’ and why ‘profit’ is not the same thing as ‘cashflow’ and it is CFO that we want to project into the future.
The first thing we want to understood is the growth in total revenue, which is the key starting point for so many aspects of business. We see here in row Total Revenue that revenue has grown over the last five years at a per annum growth rate of 47.76%, which is very high and much higher than the economy that is just growing above 6.0%. Over the longer term, growth rates of companies tend to converge to the growth rates of the markets that they operate in. So, we would expect to the 47% rate to start moving more towards 6%, but over what time and how will it decline. This is a critical question for companies that currently have very high growth rates of revenue.
Revenue forecast
To address this key issue, I have made two assumptions:
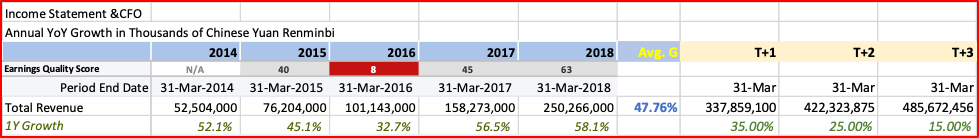
A lot of analysis and thought would have to go into the selection of these variables. My purpose here, in this article, is to illustrate the process of creating the DCF model, not to write a thesis justifying each number I chose for each particular variable.
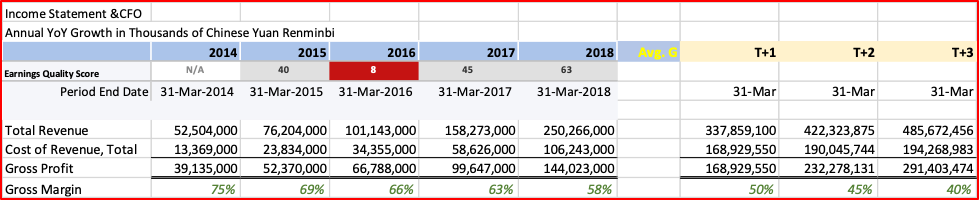
Gross profit and gross margin
This is the first indicator of profitability we look at. The Cost-of-Goods-Sold or COGS (called Cost of Revenue in this model) looks at the ‘margin’ of profits you earn when you deduct these variable costs from total revenue.
The trend here is very clear: the gross margin of Alibaba is steadily declining. That is not surprising as even at 58% its gross margin is far above what most internet providers achieve. So, its profit margin is reverting to somewhere closer to the industry average, which for domestic or international firms would be between 25% and 40%. I assume that Alibaba, given its dominant market position in China, will remain a market leader domestically and its profit margin will converge to the high end of the industry range (40%) in the near-term (3 year) forecast period.
Overhead costs (fixed costs)
In addition to the variable costs of COGS, the company has many costs that are not directly related to sales volume; we say they are fixed in the short term. This is the company’s overhead and referred to by accountants as Selling, General & Administrative (S,G&A) costs.
For Alibaba, we see the 5-year growth of S,G&A has been 49.3% or about the same (slightly higher) than the growth rate of revenue. I find that unusual as I would expect in a business like Ali’s there are good economies of scale and so this growth rate should be less than the variable revenue (and cost) items. Perhaps, it is that the company is investing heavily in creating more capacity for its future expansion.
I believe that the company will start achieving some economies of scale and I have decreased the ratioto-sales to converge to 15% in year 3.
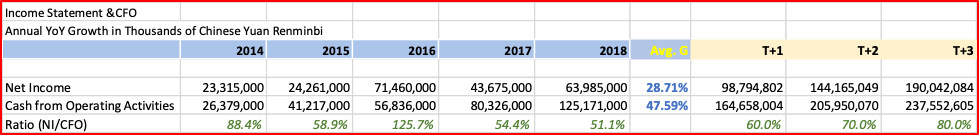
Those are the major categories for analysis. There are a few other smaller groups (‘Other Income’, etc.) but I will not go through every variable. I will add that I did converge the income tax rate to a standard 25% going forward. From this we are able to work down and calculate Net Income for the forecast period. But, we want cashflow as the value to discount and deriving that forecast from the forecast of Net Income is the next challenge.
Net Income to Cashflow
This is one of the most difficult variables to forecast. The differences between the two items are timing differences in the recognition of expenses and revenues. Over the long term, they should be roughly equal in amount. But, in the short term, they can vary greatly. I have studied in detail the CFA in the Alibaba financial statements and it is my view they will slowly start converging. My explanation for this one matter would take at least on full article to answer and so I will just state it so we can complete the illustration. In the graph below, you see that Net Income gets closer to 100% of cash flow; the items are converging.
The Residual
We have only done a detailed cash forecast for three years, but we know (or expect) the company will exist for a very long time. It would probably not be worth the effort to try and do a detailed cashflow forecast for 100 years. How can anyone predict any specific value or ratio that far in the future. So, in DCF valuation, we make a simplifying assumption. That is, we assume that cashflow will grow at some constant rate indefinitely. As we stated at the beginning of the article, we will assume cashflow grows at 10.0%, which is still higher than the economy is expected to grow but well below current growth rates. This is actually a reasonable approach as a value in 100 years (using this residual valuation method) is tiny in present value (PV) terms and so it does not matter as much as it might appear at first reading.
The residual is determined by the following formula: Value = Cashflow/(r – g)
Where: r = discount rate and g = growth rate (here, we chose 10.0%)
Next, we have to determine our final variable, the discount rate to use to present value all the future cashflows.
Discount rate for Alibaba
In Article 10 we introduced this concept in the sub-heading ‘Risk Assessment to discount rate’ and highlighted several factors we would consider in determining this rate:
We saw that the relevant index had yielded 10.97% in recent years and the Alibab Beta varied (by analyst) between 1.6 and 2.0, roughly equating to rates between 15.0 and 20.0%. Let us value the company using both 15.0% and 20.0% to determine a range of value for the stock. Note that the discount rate is used both for the individual year discounts and an input into the residual.
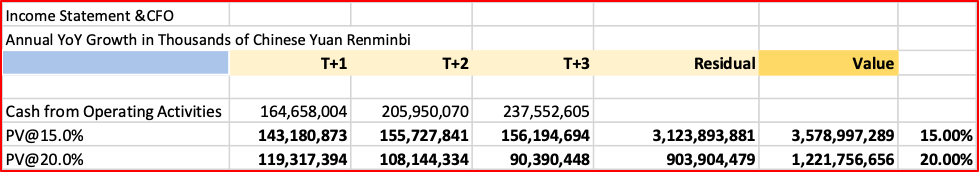
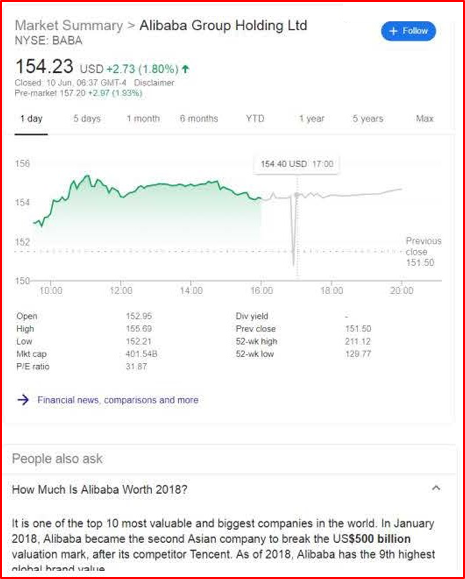
The values above are in CNY and the current exchange rate USD:CNY is today (10 June 2019) 6.93155. That means the value of the above in USD would be between USD 516.3 and 176.3 billion. As we can see below from the NASDAQ data, as of 10 June 2019 Alibaba was valued at USD 401.54 Billion – within our suggested range. This would equate to discounting our forecasts at about 16.5%.
Concluding remark to valuation
Having a systematic approach to financial analysis and investing is important, it ensures consistency in analysis and decision making. There is a great amount of information in the market but taking the approach in this article (and the previous four articles) gives you a way to manage all this information and synthesize it in an effective way. Yes, financial analysis can be difficult and time-consuming, but there are no easy ways to make good decisions in complex situations. It requires a sound method, time and experience.
John D. Evans, CFA (author) has over 24 years’ experience in the international capital markets working with issuers of securities and investors around the world. He has designed and taught Master’s programmes in investment management at universities in the UK and China. He was most recently Professor of Investment Management at XJTLU in Suzhou. He now manages SEIML, a consultancy to early-stage companies in China.
Jina Zhu (translator) did her Master’s in Economics in France and is fluent in Mandarin, English and French. She also works at SEIML supporting early-stage companies grow and raise capital in China.
18 June 2019
*********
Schedule I – Combined Income and Cashflow statement (with forecast)