Introduction
This is our ninth Article and looks at how to analyze the Cashflow Statement of a company. This is our second of three articles dedicated to understanding how to analyze the key financial statements of a company and is an extension of our previous article about financial analysis in general.
Looking at our previous articles, we see that financial statement analysis is an important part of the company analysis level (that we can also apply to competitor firms to understand the industry competition better). The final goal is to create a forecast to apply our Discounted Cash Flow (DCF) analysis (subject of article 11.) to attach a specific value to the common shares we want to invest in. But there are a few steps we need to go through first. As we will see, the Income Statement (due to ‘accruals’) does not actually show actual cash flows – the essential input for our DCF. So, after we have analyzed our Income Statement, we now need to assess the Cashflow statement (this article 9.) as the actual input for our DCF model. The Balance Sheet (article 10.) will be taken into consideration to assess the risk of the forecast that we input into our DCF – everything is connected.
Again, to illustrate our approach, we will use a common-form representation of the financial statements of Alibaba Group Holding Limited, which is registered with the Securities and Exchange Commission (SEC) in America. This statement is shown in full in Schedule I of this article.
Financial analysis: our roadmap to DCF (revisited)
Our objective is to value the common stock of a company to know whether it is a good investment given the price it is currently trading at. The valuation will be done using DCF and so inputting our forecast of the company’s future cashflows is the critical link connecting all of our analysis to this valuation process. All of the things we assess in our top-down financial analysis are what allow us to confidently predict these future cash flows – but also have an assessment of the risk associated with our forecast. The risk that we attach to our forecast will help determine the interest rate we discount future cash flows. Once again, forecasting return and risk are done in an integrated manner.
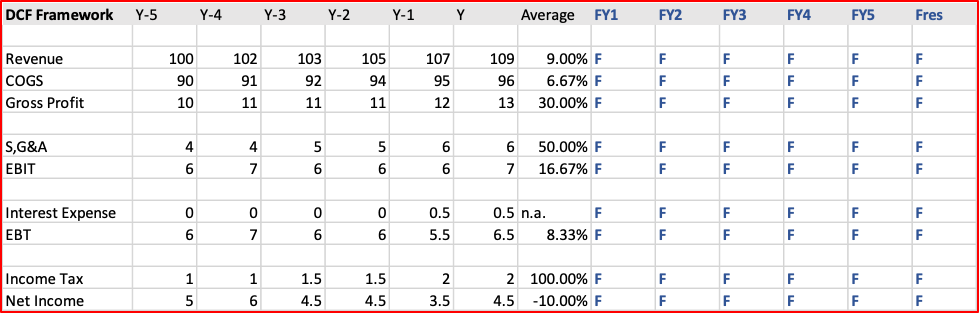
The objective, as evidenced in the above template, is to take the company’s historical data and using our judgement and other market analysis, forecast its future cashflows (the values designated by F). Not shown in the graph is the discount rate we will use; we will come to that later in the article. Income ≠ Cash Flow
If you are a very small company, with profits below a certain level, the regulator may allow you to produce your financial statements on a ‘cash basis’. So, there is no such things as ‘revenue’, just cash received. There is no such thing as ‘expense’ just cash paid. But, except for these small companies, all other companies will be required to prepare their statements on the ‘accrual basis’. We have already described the cash basis of accounting, so what is the accrual basis?
Accrual basis of accounting
“Accrual accounting is an accounting method that measures the performance and position of a company by recognizing economic events regardless of when cash transactions occur. The general idea is that economic events are recognized by matching revenues to expenses (the matching principle) at the time in which the transaction occurs rather than when payment is made (or received). This method allows the current cash inflows/outflows to be combined with future expected cash inflows/outflows to give a more accurate picture of a company’s current financial condition.” (Source: Investopedia)
Thus, if revenues and expenses are recognized at different times that cash receipts and cash payments, we have potentially large differences between Net Profit and Cashflow. Cashflow is the important financial input into our DCF valuation but we know that investors attach a lot of attention to Net Profit. Also, as companies have discretion in their accounting policies it is easier to ‘adjust’ figures that are in the Income Statement whereas you have no discretion in cashflows. Let us illustrate these ‘timing differences’ with two examples, one related to revenue and the other related to expense.
You are a consulting company and have just signed a three-year contract with your client. The value of the contract is CNY 1,500,000. In it your staff will provide ongoing consulting and research for the company, equally, over the next three years. But, because of your clients tax position, it agrees to pay you the entire sum upfront, in-advance. You estimate your labour and other costs will be about CNY 350,000 per year. I present this business agreement below, both on a cash basis and an accrual basis.
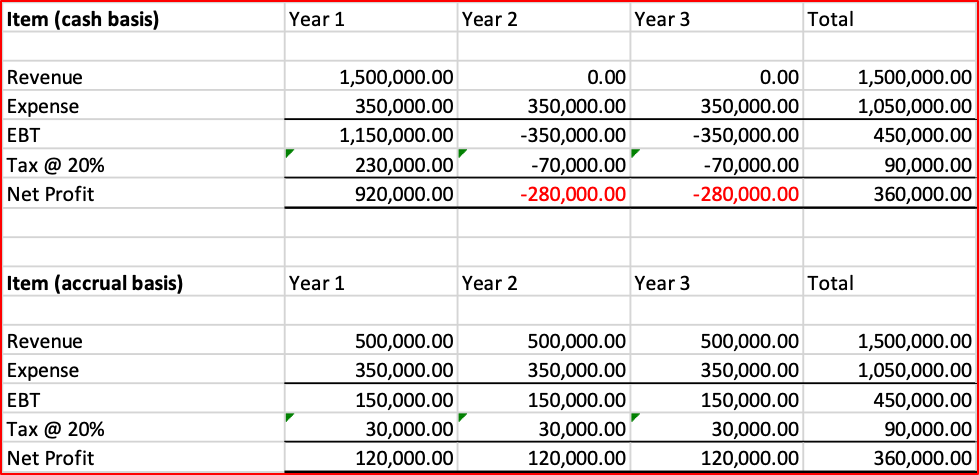
The above chart is the same financial contract, just presented in two different ways. Here are a few observations:
Accruals do not just apply to sources of revenue, they often apply more to large expense items due to the policy of the depreciation of large capital assets. Let us look at how a company would treat the expense of building and running a very large factory. The simple scenario here is that a company builds a manufacturing plant at a total capital cost of CNY 3,300,000. From this factory, it is able earn annual income of CNY 1,500,000. On a cash basis, it shows a full cost of CNY 3,300,000 in the first year but has no capital costs in years 2 and 3. On an accrual basis, the capital cost is depreciated (spread) over three years in equal, annual amounts (in reality, depreciation of buildings is over a much longer time, often ten to twenty years).

Again, the above chart is the same financial contract, just presented in two different ways. Here are a few observations:
Many professors of accounting theory and principle support accrual accounting as they believe it better portrays a company’s ‘true economic value’ at a point in time. There is also a desire to ‘match’ related revenues and expenses into the same period so that we can monitor profit margins and trends. But it is only cash flow statements that let us know how much cash a company actually has at a point-in-time to meet its liabilities as they become do. Also, importantly, it is cashflow numbers we need to put into our DCF valuation model. As a consequence, companies are required to provide both an Income Statement and a Cashflow Statement in their financial reports, meeting all requirements for information.
Format of the Cashflow Statement
The Cashflow statement not just a conversion of the Income Statement back to a ‘cash basis’. Rather it is structured into three important categories to give the reader information about cash flow related to operations, investment activities and financing activities. A general description is below:
Net Income (from Income Statement)
= Cashflow from operating activities
= Cashflow from investing activities
= Cashflow from financing activities
= Company cashflow for the year (this is the number we use for our DCF valuation)
Although we now have derived our cashflow number, we can learn more about the company from the segmentation of cashflow activities above. Here are just some general thoughts.
Though Net Income tells us about fundamental profitability, cashflow from operating activities tells us how efficiently the company is being managed financially. If we make a lot of sales but don’t collect the money on those sales, then this will be highlighted in a low or negative cashflow from operations.
Investing activities are very important for many companies and Cashflow from investing activities tells us how much the company is investing in its future. We would want to monitor the trend here and see how the amount of its investments compare to its competitors.
A company may need to invest a lot for the future but it must also pay for those investments. If a company is very profitable, it may be able to pay out of its own cashflow. But, often, it will need to raise external capital. Is borrowing from the bank or issuing a bond (raising its financial risk) or is it issuing more equity and potentially diluting the existing shareholders.
The above analysis of these three sections of the Cashflow statement are very complex and the Cashflow statement is what analysts spend much time reading. People who only look at the Income Statement can be missing a lot of important information.
Just for illustration, I have listed below the Net Profit and Cash Flow for Alibaba for recent years. We can see big differences between the two figures in each year.

Concluding remarks
Financial analysis is a complex subject that requires a systematic approach to the analysis of data and markets. The top-down, four stage model introduced in a previous article is a common approach taken by equity analysis, though there are other models as well. This article looks at our second step of company financial analysis by reviewing the Cashflow Statement. The next article will look at further company financial analysis (articles 10) and close off with discounted cash flow analysis (article 11) to reach our valuation objective.
*****
Having a systematic approach to financial analysis and investing is important, it ensures consistency in analysis and decision making. There is a great amount of information in the market but taking the approach in this article (and the following two articles) gives you a way to manage all this information and synthesize it in an effective way. Yes, financial analysis can be difficult and time-consuming, but there are no easy ways to make good decisions in complex situations. It requires a sound method, time and experience.
John D. Evans, CFA (author) has over 24 years’ experience in the international capital markets working with issuers of securities and investors around the world. He has designed and taught Master’s programmes in investment management at universities in the UK and China. He was most recently Professor of Investment Management at XJTLU in Suzhou. He now manages SEIML, a consultancy to early-stage companies in China.
Jina Zhu (translator) did her Master’s in Economics in France and is fluent in Mandarin, English and French. She also works at SEIML supporting early-stage companies grow and raise capital in China.
18 May 2019